
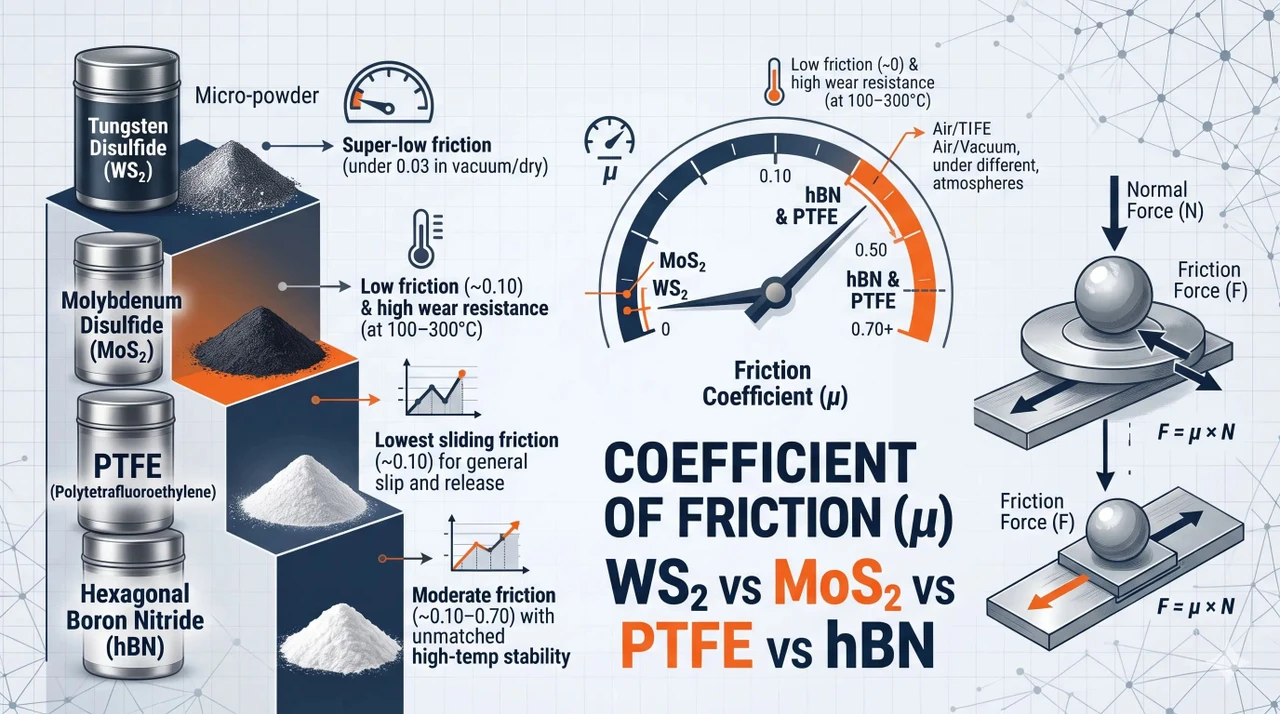
However, the coefficient of friction is not a fixed material property. It depends on the contacting surfaces, load, sliding speed, temperature, operating environment and material formulation.
This reference compares peer-reviewed experimental findings, including actual test conditions, wear measurements and practical considerations.
1. Dry Lubricant Friction Coefficient Comparison Table
| Dry lubricant | Reported friction coefficient (μ) | Test material and conditions | Research source |
|---|---|---|---|
| Tungsten disulfide (WS₂) | Below 0.03 initially; approximately 0.07 after extended sliding | Sputtered WS₂ film on AISI 440C steel; 5 N load; vacuum | Hu et al., 2019 |
| Molybdenum disulfide (MoS₂) | Approximately 0.20 at 25°C; below 0.10 at 100–300°C | Loose powder; silicon nitride contact; 30 N load; air | Wang et al., 2022 |
| Hexagonal boron nitride (hBN) | Approximately 0.30–0.45 at 100°C; 0.55–0.70 at 200–400°C | Loose powder; silicon nitride contact; 30 N load; air | Wang et al., 2022 |
| Polytetrafluoroethylene (PTFE) | 0.100–0.120 across three motion types | Bulk PTFE disc against AISI 1045 steel pin; 123 N load; ambient air | Wang et al., 2017 |
A meaningful comparison requires similar contacting surfaces, applied loads, environmental conditions and testing procedures.
2. MoS₂ vs hBN: How Does Temperature Affect Friction?
A 2022 study published in Materials Research Express examined the tribological behaviour of MoS₂, hBN and graphite powders in silicon nitride sliding contacts.
Experimental conditions
| Test parameter | Published conditions |
|---|---|
| Contact materials | Silicon nitride (Si₃N₄) pin and disc |
| Normal load | 30 N |
| Motion | Reciprocating |
| One-way stroke | 10 mm |
| Frequency | 3 Hz |
| Powder particle size | 3–5 µm |
| Initial powder-layer thickness | Approximately 2 mm |
| Relative humidity | 39–41% |
| Test temperatures | 25°C, 100°C, 200°C, 300°C and 400°C |
Published friction coefficient results
| Temperature | MoS₂ powder | hBN powder |
|---|---|---|
| 25°C | Approximately 0.20 | Not separately quantified in the comparison text |
| 100°C | Below 0.10 | 0.30–0.45 |
| 200–300°C | Below 0.10 | 0.55–0.70 |
| 400°C | Increased and fluctuated after approximately 600 seconds | 0.55–0.70 |
Source: Wang et al., 2022, Section 3.2.1.
What the research shows
MoS₂ maintained comparatively low friction between 100°C and 300°C under the tested conditions.
At 400°C, the researchers observed increasing friction fluctuations in the MoS₂-lubricated contact and associated them with oxidation.
For hBN, the reported friction coefficients increased substantially at 200–400°C.
These results concern the tested ceramic sliding system. They do not establish a universal performance ranking for MoS₂ and hBN across other substrates or formulations.
3. Wear Comparison at 400°C: MoS₂ vs Graphite vs hBN
The same researchers measured the depth of the wear tracks after testing the powders at 400°C.
| Lubricating material | Measured wear-track depth |
|---|---|
| MoS₂ powder | 24.96 µm |
| Graphite powder | 157.3 µm |
| hBN powder | 172.8 µm |
Source: Wang et al., 2022, Figure 6.
Calculated comparison
Compared with hBN, the MoS₂-lubricated contact produced an approximately 85.6% shallower wear track.
Calculation:
This is a comparison of measured wear-track depths, not a measurement of total wear-volume reduction.
4. WS₂ Coatings: How Much Does Preparation Affect Wear Life?
A 2019 study in Coatings examined tungsten disulfide films deposited at different initial substrate temperatures.
Test conditions
| Parameter | Experimental value |
|---|---|
| Lubricant form | Sputtered WS₂ thin film |
| Substrate | AISI 440C stainless steel |
| Counterface | 8 mm AISI 440C steel ball |
| Normal load | 5 N |
| Sliding speed | Approximately 0.84 m/s |
| Test environment | Vacuum below 5 × 10⁻³ Pa |
| Test temperature | Room temperature |
Coating wear-life comparison
| Initial deposition temperature | Reported wear life |
|---|---|
| Room temperature (~20°C) | Less than 150,000 sliding cycles |
| −25°C | More than 500,000 sliding cycles |
| −40°C | More than 500,000 sliding cycles |
The WS₂ films deposited at −25°C and −40°C maintained an average friction coefficient below 0.03 during the initial 100,000 sliding cycles.
Measured WS₂ film wear rates
| Film preparation | Wear rate (mm³/N·m) |
|---|---|
| −40°C | 0.23 × 10⁻⁶ |
| −25°C | 0.40 × 10⁻⁶ |
| 0°C | 0.44 × 10⁻⁶ |
| Room temperature | 1.35 × 10⁻⁶ |
Calculated finding: The WS₂ film deposited at −40°C exhibited an approximately 83% lower wear rate than the room-temperature-deposited film.
The researchers attributed the improved performance to differences in coating microstructure and the formation of a more effective lubricating transfer layer.
Source: Hu et al., 2019, Coatings, 9(4), 227.
These are sputtered-film results, not measurements of loose tungsten disulfide powder.
5. PTFE Friction vs Wear: Why Lower Friction Does Not Always Mean Lower Wear
A study published in Journal of Tribology examined a sintered PTFE disc sliding against an AISI 1045 steel pin.
Three types of sliding motion were tested under comparable conditions.
Experimental conditions
| Parameter | Value |
|---|---|
| Contact materials | PTFE disc and AISI 1045 steel pin |
| Normal load | 123 N |
| Equivalent sliding speed | 3.5 mm/s |
| Test duration | 360 minutes |
| Environment | Ambient air |
| Relative humidity | 45–60% |
Friction and wear comparison
| Sliding motion | Friction coefficient | PTFE wear mass loss |
|---|---|---|
| Unidirectional rotation | 0.100 | ~1.3 mg |
| Linear reciprocation | 0.118 | ~2.06 mg |
| Torsion | 0.120 | ~0.64 mg |
Source: Wang, Niu and Teng, Journal of Tribology, DOI: 10.1115/1.4033130.
What makes this finding useful?
The torsional test produced the highest friction coefficient but the lowest PTFE wear mass loss.
The study demonstrates that friction and wear are related but distinct performance measures.
A material or operating condition that reduces sliding resistance does not necessarily minimise material loss.
These results were obtained using bulk sintered PTFE. They should not be treated as performance specifications for micronized PTFE lubricant additives.
6. How Do Atmosphere and Pressure Affect hBN Friction?
Research by Martin and colleagues examined hot-pressed hexagonal boron nitride sliding against itself under different environmental conditions.
The results were subsequently summarised in Ali Erdemir's chapter Solid Lubricants and Self-Lubricating Films, published in the Modern Tribology Handbook.
Reported hBN friction coefficients
| Environment | Steady-state friction coefficient |
|---|---|
| Ambient air, approximately 50% RH | ~0.10 |
| Ultrahigh vacuum, 10⁻⁸ Pa | 0.60–0.70 |
Research sources:
These published results indicate a substantial difference between the reported air and ultrahigh-vacuum conditions.
The original researchers investigated several gas atmospheres, pressures and crystallographic orientations.
These figures represent a particular hot-pressed hBN-on-hBN contact configuration. They do not describe every hBN powder, lubricant additive or finished coating.
7. How Much Can a Lower Friction Coefficient Reduce Sliding Force?
For a simplified sliding contact:
Friction force = Coefficient of friction × Normal force
Or:
F = μ × N
Where:
- F = Friction force, in newtons
- μ = Kinetic coefficient of friction
- N = Normal force, in newtons
Example: 100 N normal load
| Assumed friction coefficient | Calculated friction force |
|---|---|
| 0.05 | 5 N |
| 0.10 | 10 N |
| 0.20 | 20 N |
| 0.30 | 30 N |
Under otherwise unchanged conditions, reducing the friction coefficient from 0.20 to 0.05 corresponds to a 75% reduction in calculated friction force.
This is a theoretical calculation, not a measured lubricant performance result.
It does not establish a 75% reduction in equipment energy consumption, since real machinery also experiences other mechanical and electrical losses.
8. Practical Dry Lubricant Selection Checklist
Before choosing a solid lubricant, engineers should assess the actual operating requirements.
| Selection factor | What to verify | Why it matters |
|---|---|---|
| Contact material | Steel, aluminium, ceramic or polymer | Different material pairs produce different friction and wear behaviour |
| Normal load | Applied force and contact pressure | Influences contact stress and wear |
| Operating temperature | Continuous and peak temperature | Affects stability and lubricating-film formation |
| Sliding motion | Rotation, reciprocation or oscillation | Can change friction and wear mechanisms |
| Operating environment | Air, humidity, vacuum or reactive gases | Can affect surface reactions and lubrication behaviour |
| Lubricant form | Powder, bonded coating, sputtered film or formulated additive | Results cannot automatically be transferred between forms |
| Particle size | Size distribution and application requirements | Influences dispersion, surface finish and formulation behaviour |
| Performance evidence | Friction, wear, durability and test conditions | Allows a more reliable technical comparison |
Relevant Testing Standards
Two recognised ASTM methods provide useful reference frameworks for friction and wear evaluation.
ASTM G99-23 — Standard Test Method for Wear and Friction Testing with a Pin-on-Disk or Ball-on-Disk Apparatus.
ASTM G133-22 — Standard Test Method for Linearly Reciprocating Ball-on-Flat Sliding Wear.
These standards describe established testing procedures. Their mention does not imply that every study referenced in this article followed these standards.
9. Explore Related Lower Friction Products
The following material categories can be considered for preliminary technical evaluation based on the required application.
| Material | Typical evaluation focus | Product information |
|---|---|---|
| Tungsten disulfide (WS₂) | Dry films, lubricant additives and high-load sliding applications | WS₂ Powder |
| Molybdenum disulfide (MoS₂) | Sliding contacts, grease additives and wear reduction | MoS₂ Powder |
| Hexagonal boron nitride (hBN) | High-temperature lubrication, release and thermal-management formulations | hBN Powder |
| PTFE | Coating additives, polymer formulations, slip and release applications | PTFE Micronized Powder |
For additional material grades and particle-size options, explore the Dry and Solid Lubricant Powders category.
Product selection should be supported by the current technical documentation and testing under the intended operating conditions.
Conclusion
Published experiments demonstrate that WS₂, MoS₂, PTFE and hBN can exhibit substantially different friction and wear behaviour depending on the contacting surfaces, environment, material preparation and test conditions.
The most useful lubricant comparison is not simply the lowest friction coefficient reported in scientific literature.
It is the result measured under conditions that most closely represent the intended application.
Research References
1. Hu, M., et al. (2019). Low Deposition Temperature-Induced Changes of the Microstructure and Tribological Property of WS₂ Film. Coatings, 9(4), 227.
Publisher: MDPI
https://doi.org/10.3390/coatings9040227
2. Wang, Z., et al. (2022). Effect of Powder Lubrication on Wear Characteristics of Silicon Nitride During Sliding at High Temperature. Materials Research Express, 9, 046403.
Publisher: IOP Publishing
https://doi.org/10.1088/2053-1591/ac62b7
3. Wang, S., Niu, C., and Teng, B. (2017 volume; published online in 2016). Tribological Behavior of Polytetrafluoroethylene: Effect of Sliding Motion. Journal of Tribology, 139(1), 011301.
Publisher: ASME
https://doi.org/10.1115/1.4033130
4. Martin, J. M., Le Mogne, T., Chassagnette, C., and Gardos, M. N. (1992). Friction of Hexagonal Boron Nitride in Various Environments. Tribology Transactions, 35(3), 462–472.
Publisher: Taylor & Francis
https://doi.org/10.1080/10402009208982144
5. Erdemir, A. (2000/2001). Solid Lubricants and Self-Lubricating Films. In Modern Tribology Handbook, CRC Press.
Table 22.3 summarises the hBN environmental friction results from Martin et al. (1992).
https://doi.org/10.1201/9780849377877.ch22
6. ASTM International. ASTM G99-23: Standard Test Method for Wear and Friction Testing with a Pin-on-Disk or Ball-on-Disk Apparatus.
https://store.astm.org/g0099-23.html
7. ASTM International. ASTM G133-22: Standard Test Method for Linearly Reciprocating Ball-on-Flat Sliding Wear.
https://store.astm.org/g0133-22.html
Technical information notice: This article is for general information and preliminary evaluation only. It does not guarantee performance or suitability. Review the current SDS, TDS and product specifications, try a small sample first, and confirm suitability before bulk use. Read the full disclaimer.